Strivenn Thinking
Pull up a seat at our
digital campfire
where story, strategy,
and AI spark
new possibilities
for sharper brands
and smarter teams.
Fortuna's Wheel Never Stops Spinning
By Jasmine Gruia-Gray
Why Market Sizing Haunts Product Marketers (And What To Do About It)
In Roman mythology, Fortuna was the goddess of fortune and fate. Romans built temples to her in every district, placed her image on coins, and sacrificed at her altars obsessively. She appeared holding a cornucopia promising abundance, standing on a sphere showing instability, spinning a wheel that could elevate you to consul or drop you into ruin. Most unsettling was her blindfold. Fortuna distributed prosperity and disaster without seeing who received which fate.
Roman generals built elaborate battle plans. Merchants calculated trade routes. Senators strategized alliances with precision. Then they sacrificed to Fortuna anyway, understanding what modern Product Marketers (PMs) resist: you can prepare brilliantly and still face outcomes beyond your control.
Market sizing is Product Management's temple to Fortuna. You build TAM models (Total Addressable Market, the revenue opportunity if you achieved 100% market share), analyze competitive revenue, track publication trends, and triangulate data sources. You present confident projections: "The addressable market is $450M growing at 12% annually." But Fortuna's wheel keeps spinning. Competitors launch early. Key opinion leaders publish contradictory data. NIH changes grant priorities. The market you sized evaporates or explodes in ways your model never predicted.
This is why "What's our realistic market size and revenue potential?" haunts PMs more than any other question. It demands prophecy when you have only analysis.
The Market Sizing Fear Is Justified
When PMs get market sizing wrong, the consequences compound. Overestimate and you waste development resources on products that will likely miss revenue targets, burn runway chasing phantom customers, or build sales teams for markets that don't exist.
Underestimate and you kill viable products in portfolio reviews. A colleague's flow cytometry reagent line got defunded because their conservative TAM analysis showed $25M potential. A competitor launched the same concept two years later and hit $60M in year three. The market was there. The analysis wasn't.
Life sciences amplifies these risks. Academic markets move slowly but pharma adoption can accelerate overnight when a technique hits a tipping point. RUO tools live in the gap between research publication (provable demand signal) and commercial traction (lag time of 18-36 months). You're sizing markets that don't fully exist yet, using data about what researchers published last year to predict what labs will budget for next year.
The Four-Layer Validation Framework
Fortuna favors the prepared. Your market sizing won't predict the future perfectly, but you can build models robust enough to survive when her wheel turns. Here's the validation framework that actually works:
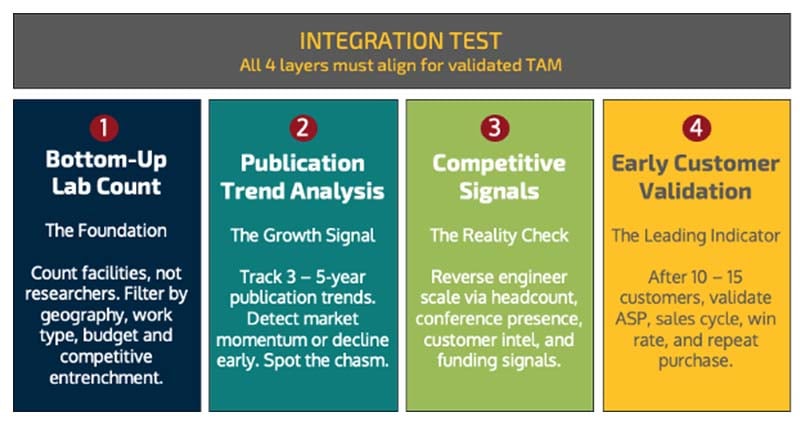
Layer 1: Bottom-Up Lab Count (The Foundation)
Start by counting labs, not individual researchers. Labs control budgets and purchasing decisions.
Filter ruthlessly:
- Total potential labs in your geography
- Labs doing relevant work (publication-based filter)
- Labs with budget capacity (significant annual equipment/reagent spend)
- Labs without competitive entrenchment (not locked into long-term platform contracts)
Example: You're sizing the market for a novel multiplex immunoassay kit for cytokine profiling. Start with US academic core facilities. Filter to immunology/oncology focus. Filter to those running Luminex or similar platforms. Filter to those publishing relevant papers annually. Each filtering step narrows your addressable market to facilities with realistic near-term potential.
That's not your total market. That's your beachhead. But it's defensible because every assumption can be checked.
Layer 2: Publication Trend Analysis (The Growth Signal)
Track publications using your technique or addressing your application over 3-5 years. This reveals whether you're entering a mature, declining, or emerging market.
Use PubMed with specific MeSH terms and methodology filters. Graph the trend. If publications using "single-cell RNA sequencing" grew 300% between 2020-2024, you have proof of market momentum. If papers on "2D gel electrophoresis" declined 40%, you're fighting Fortuna's wheel turning against you.
This layer catches the Crossing the Chasm problem early. Publications plateau? You're hitting the chasm between early adopters and pragmatist majority. Publications accelerating? The tornado might be starting.
Layer 3: Competitive Revenue Triangulation (The Reality Check)
Estimate competitor unit sales multiplied by average selling price. Cross-check against their reported revenue if they're public or venture-backed with disclosed metrics.
For a qPCR reagent kit priced at $850, if your competitor sold 2,000 units last year, that's $1.7M in that product line. If they're claiming the market is $50M and they have 15% share, the math doesn't work. Either their market share estimate is incorrect, the market is smaller, or ASP is different than you think.
This layer prevents the fantasy TAM that assumes every lab on earth is addressable. Real revenue data grounds your model in what customers actually spend, not what analysts think they might spend.
Layer 4: Early Customer Pattern Validation (The Leading Indicator)
After your first 10-15 customers, calculate:
- Average deal size (ASP reality check)
- Sales cycle length (how long before revenue?)
- Win rate by segment (academic vs. pharma vs. core facility)
- Repeat purchase rate (are they coming back?)
If you modeled $750 ASP but actual deals average $520 because of academic discounts, your TAM just shrunk 30%. If you assumed 60-day sales cycles but pharma procurement takes 180 days, your revenue timeline just tripled.
This is where Fortuna's wheel reveals itself. The market exists, but it behaves differently than projected. Adjust the model or accept that your forecasts will miss.
The Integration Test
Your market sizing passes validation when all four layers align:
- Bottom-up facility count × realistic adoption rate × ASP = revenue estimate
- Publication trends support growth assumptions
- Competitive revenue triangulation confirms market size claims
- Early customer patterns validate pricing, cycle time, and segment assumptions
Misalignment signals danger. If your bottom-up math says $30M but competitive triangulation suggests $80M, one model is broken. If publications are flat but you're projecting 20% growth, you're wish-casting.
Fortuna's Lesson: Build The Offering, Accept The Outcome
Fortuna didn't punish careful planning. Romans who prepared thoroughly and sacrificed appropriately often prospered. She punished hubris, the assumption that perfect analysis controls outcomes.
Your market sizing is your offering to Fortuna. Build it rigorously: validate across multiple layers, triangulate data sources, update assumptions as reality unfolds. Present it confidently but hold it loosely. The market will surprise you. Competitors will move unpredictably. Research trends will shift.
Define your beachhead market with bottom-up precision. Track leading indicators relentlessly. Validate assumptions through real customer behavior. Then launch, knowing Fortuna's wheel will spin and your job is responding wisely when it does.
The best PMs don't predict the future. They build models robust enough to survive multiple futures, then adapt faster than competitors when Fortuna reveals which future arrived.